Hawkmail

 Simulators & Vehicles
Research
Media & Events
Staff
Simulators & Vehicles
Research
Media & Events
Staff
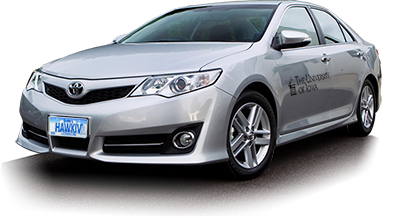
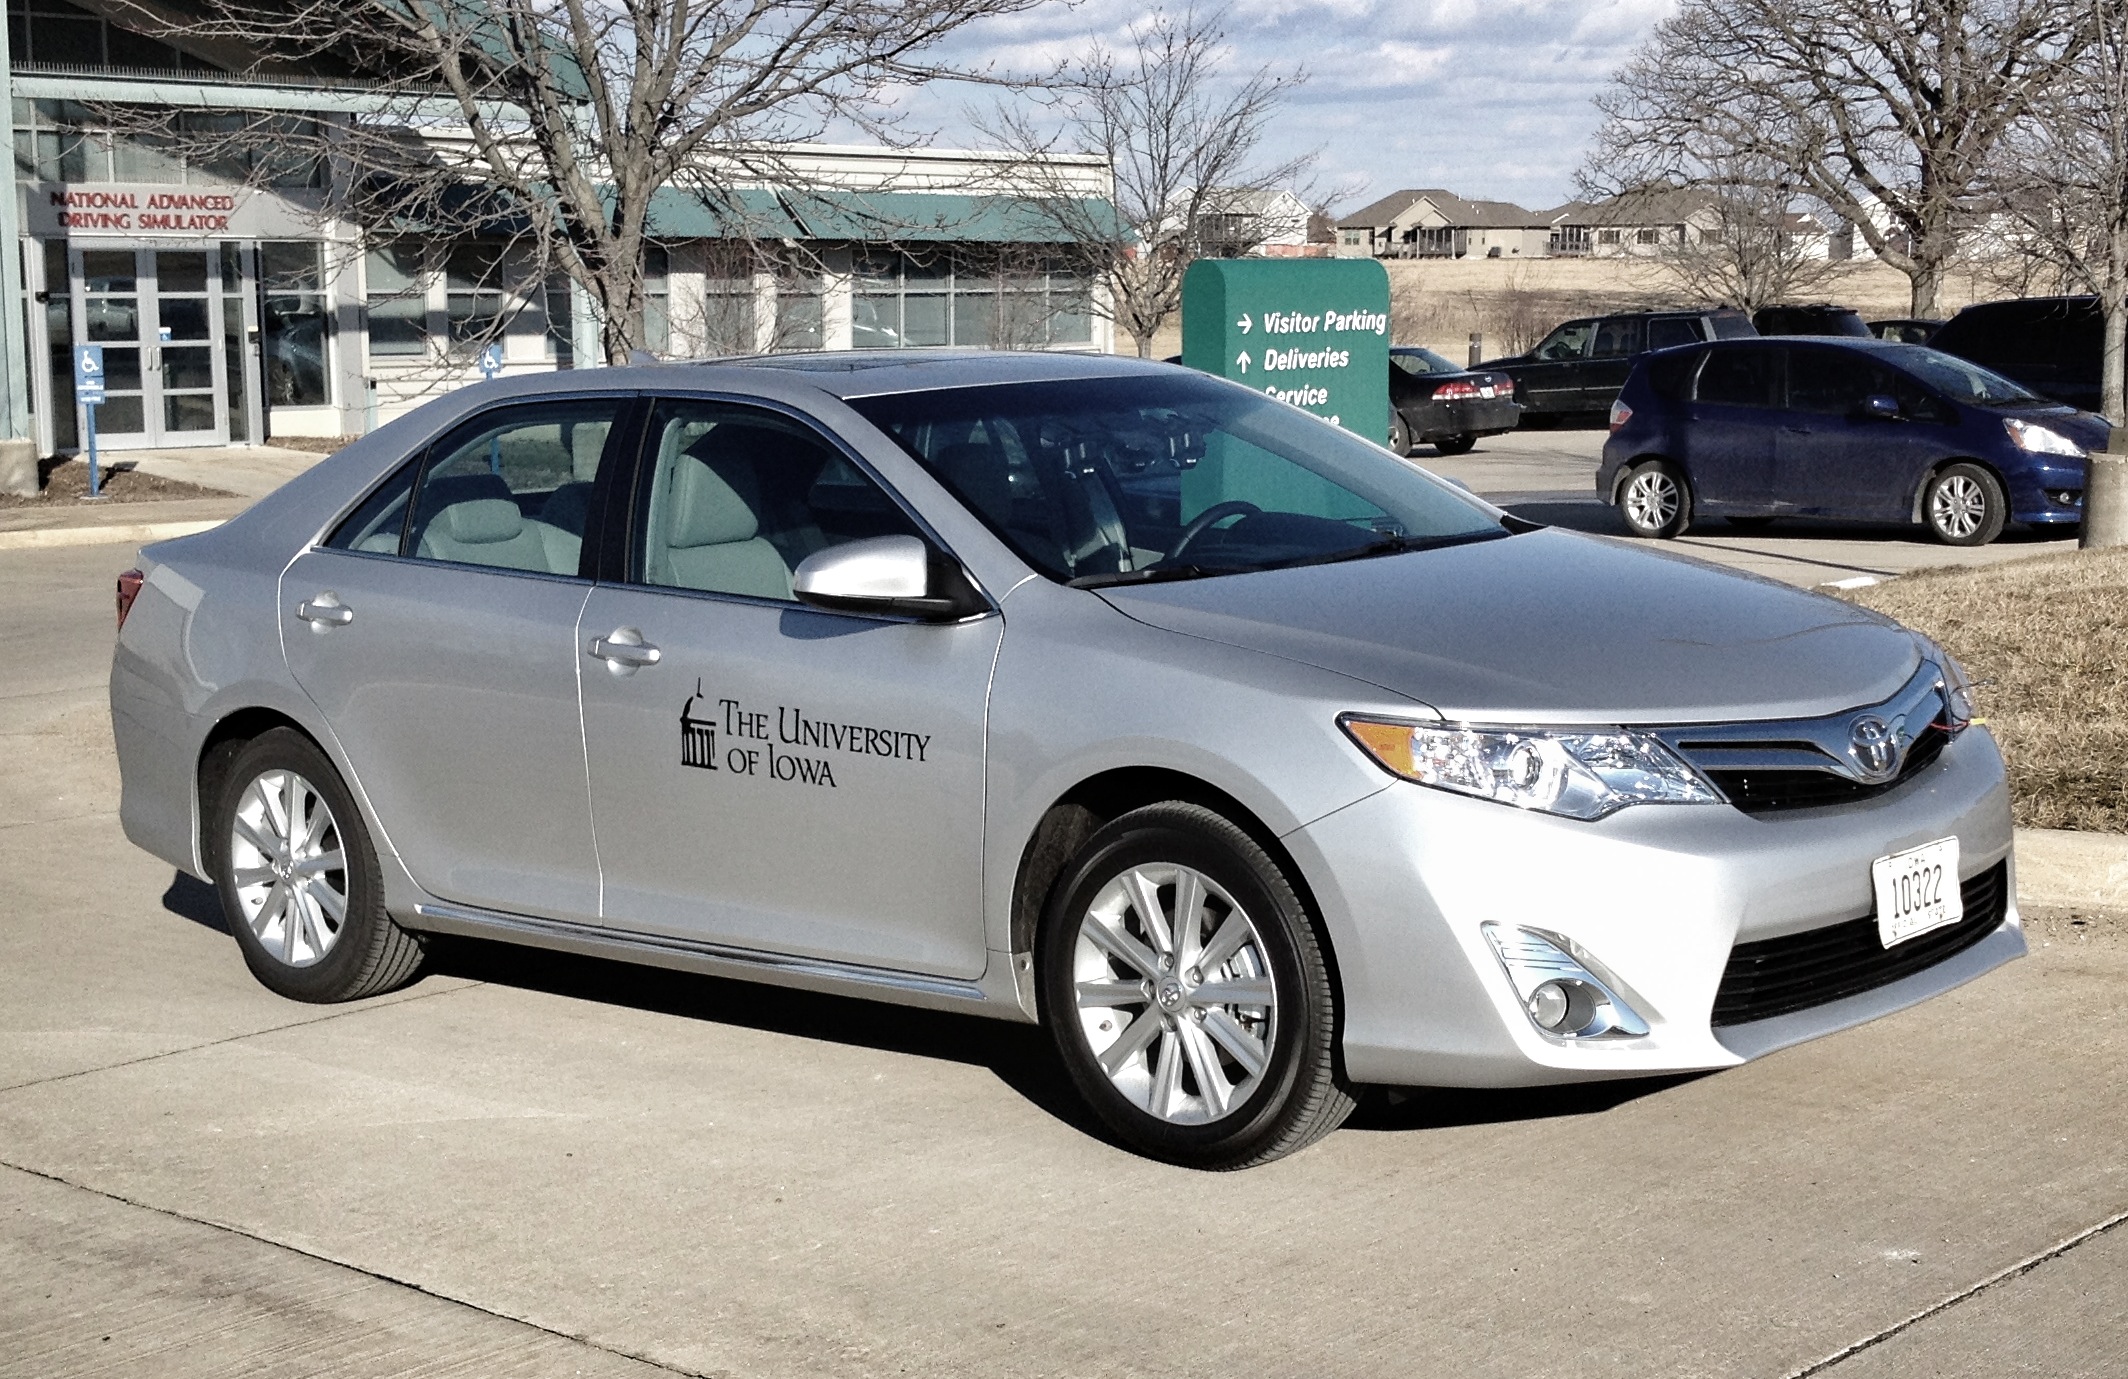
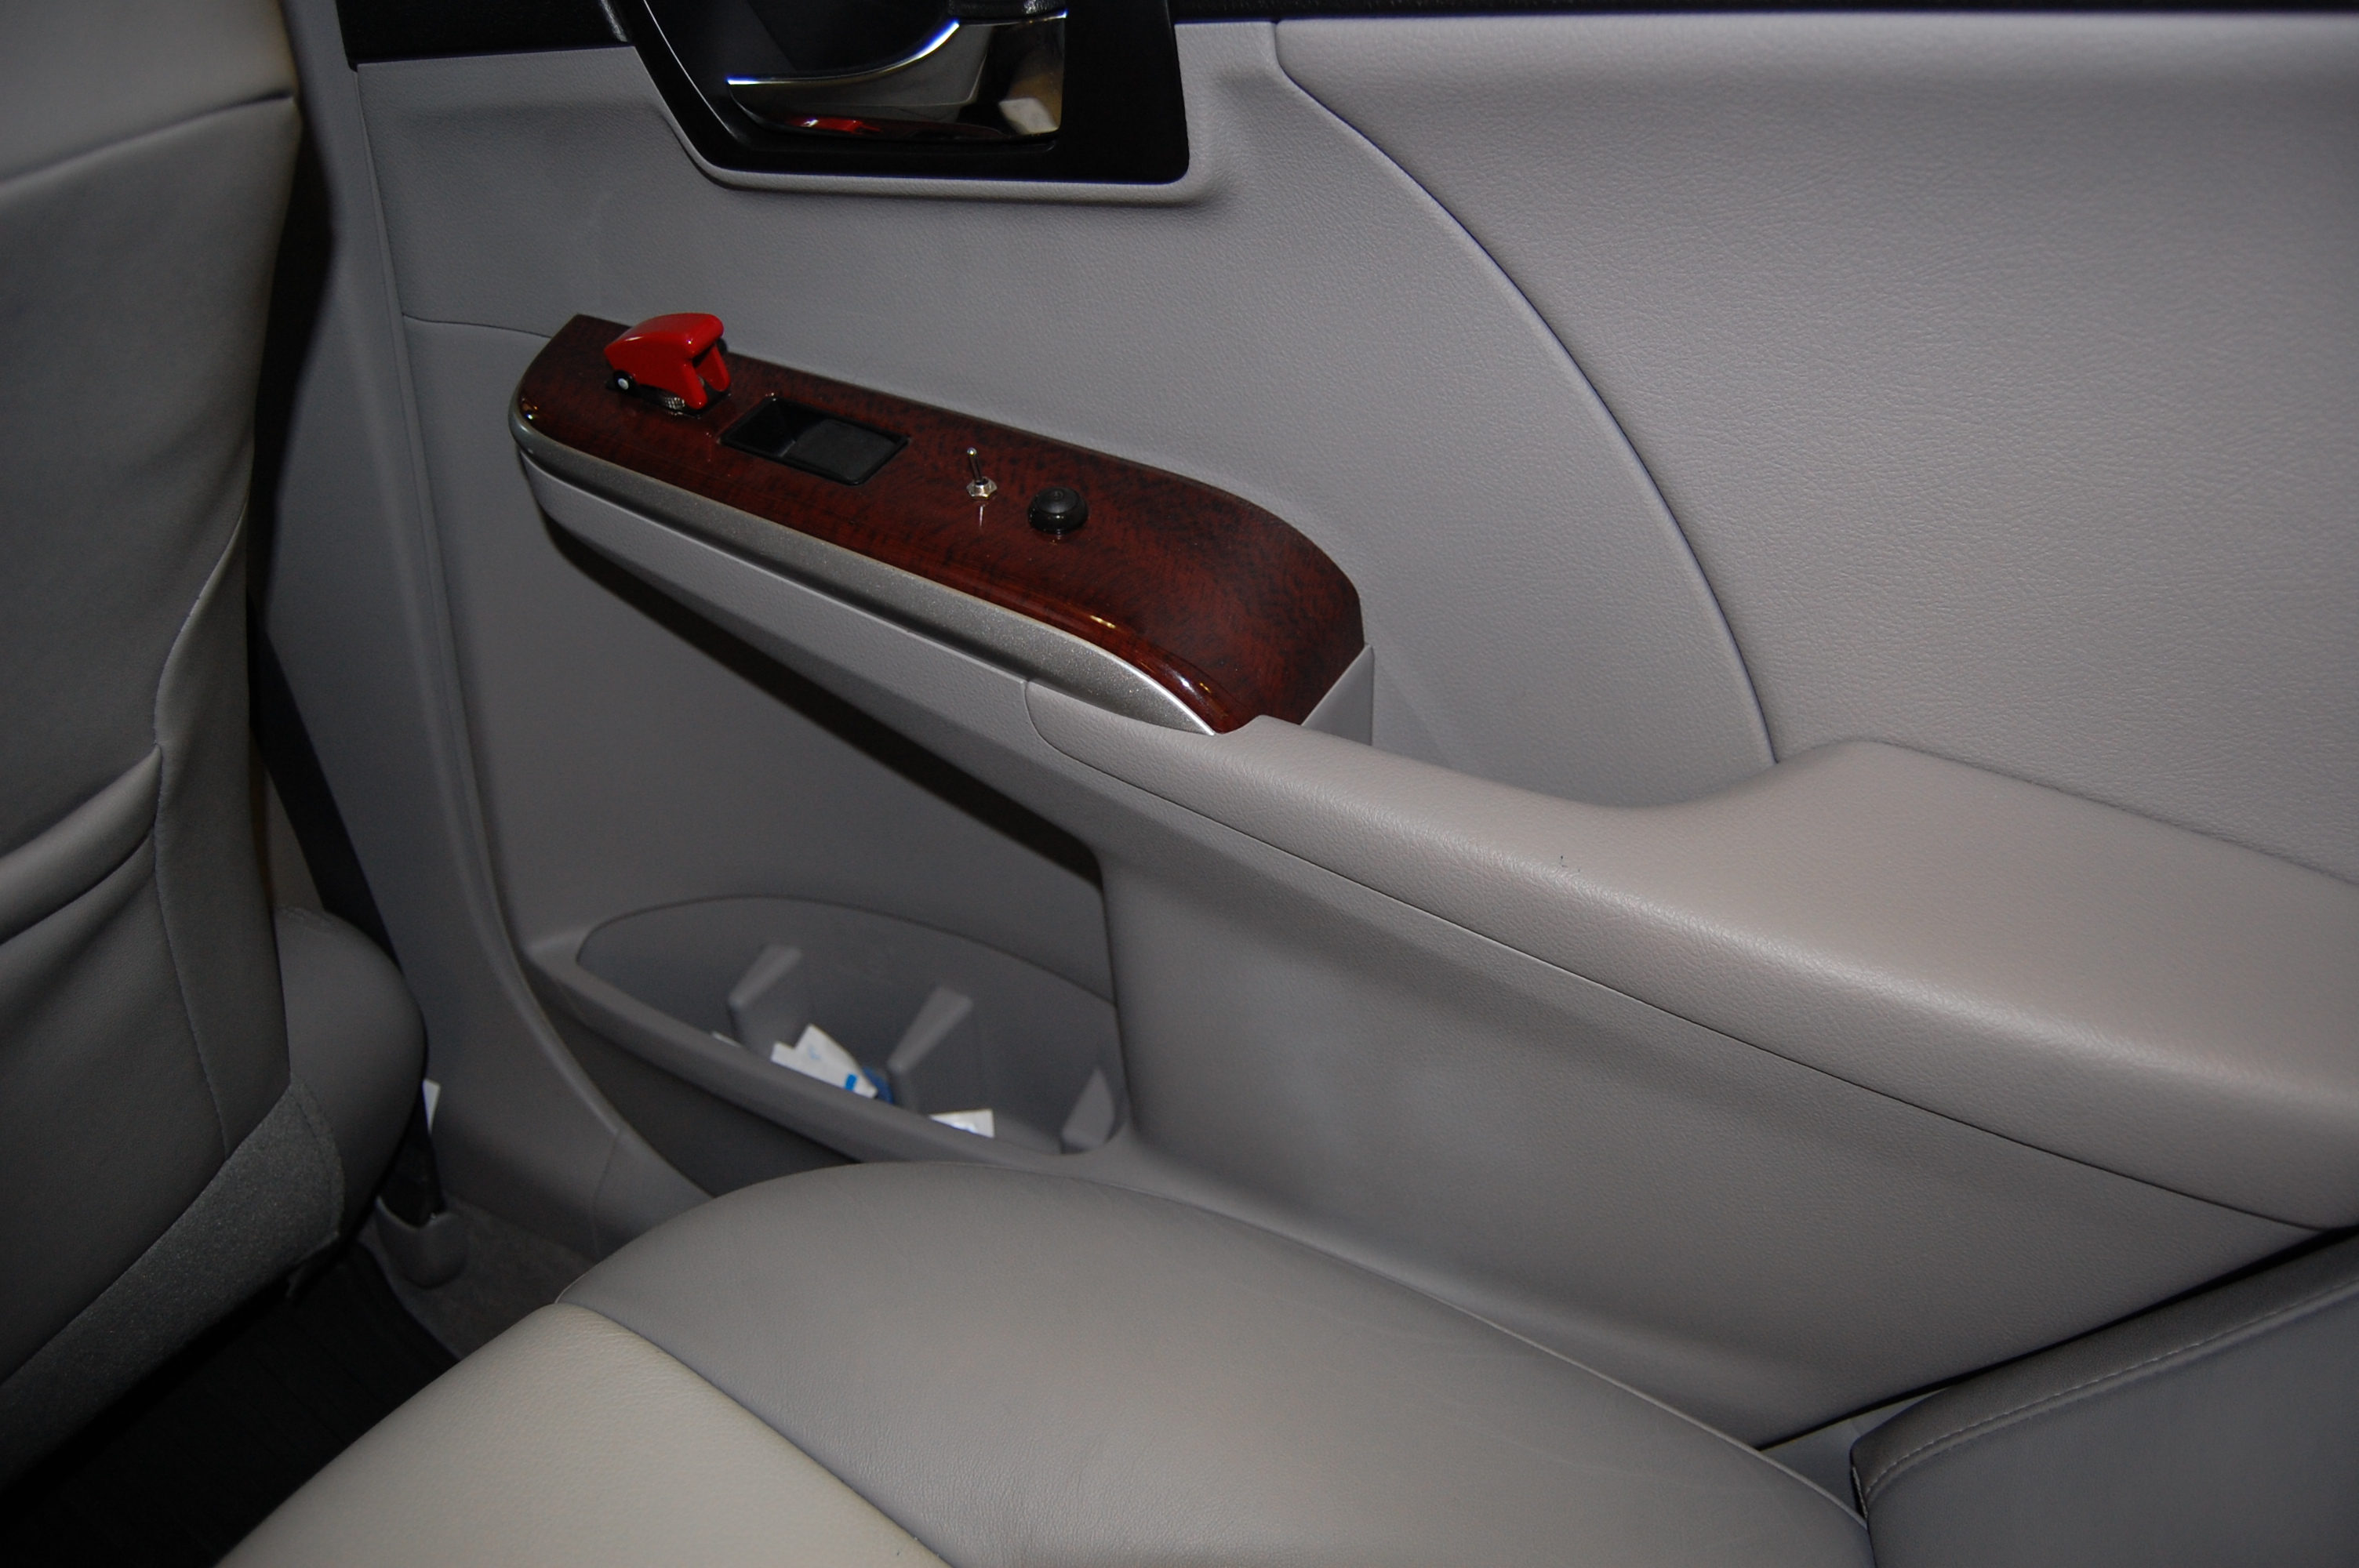
This Toyota Camry XLE is an on-road vehicle which also supports a simulator mode of operation. To support data collection, this vehicle is instrumented with cameras, sensors and a custom addressable nine-inch color multi-function touchscreen display in the dashboard. All instrumentation and cameras are cleanly integrated into the vehicle’s interior where there are no cables visible to the driver. While this vehicle can be used for extended field trials with no experimenter, there are also custom programmable switches in the rear seat that can be operated by an experimenter for a variety of uses including inserting data markers for study specific purposes. The vehicle has been used for a connected vehicle study for NHTSA and pedal response study for an industry sponsor. The instrumentation hardware and software has been sourced and developed by NADS so it can be duplicated for larger fleet of instrumented vehicles as needed.
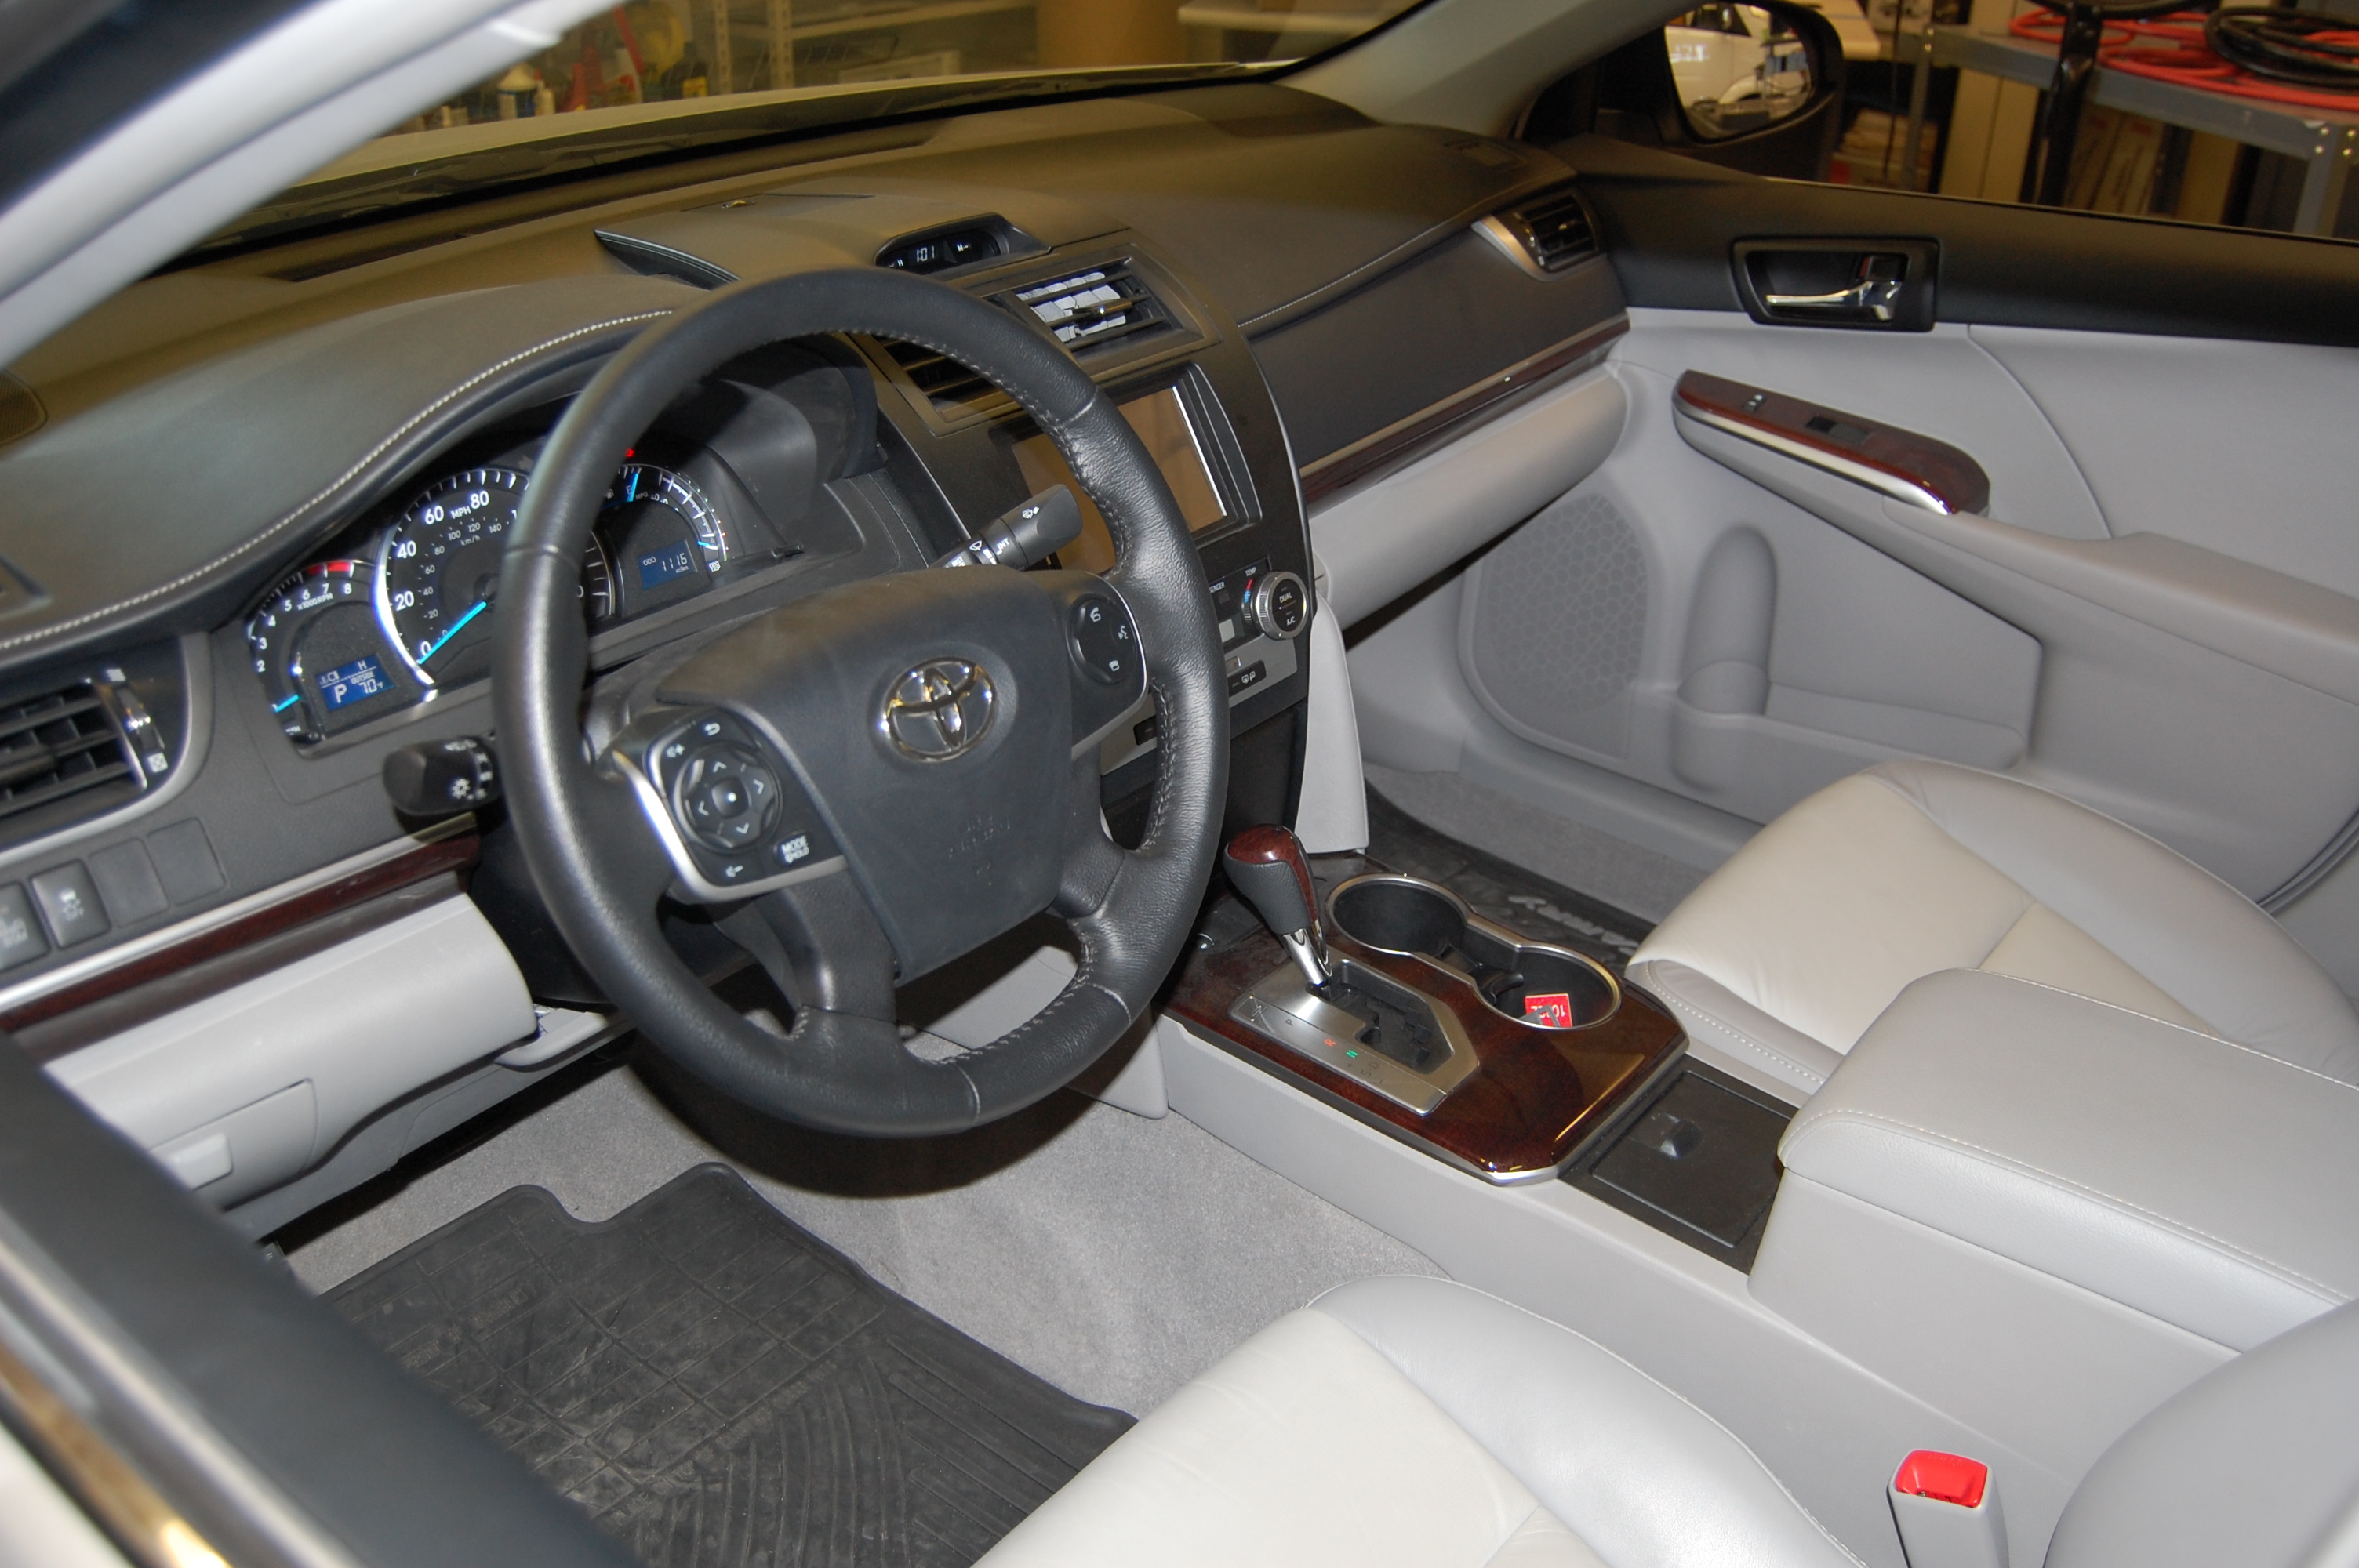
A unique feature of the instrumented vehicle is that it supports a simulator mode of operation. The vehicle has a drive-in booth in the garage at the NADS facility where it can be converted into a limited simulator within 15 minutes. The vehicle is parked in front of a 60 inch flat screen display that provides the visuals. The current configuration allows drivers to respond to pre-recorded videos of simulation drives by pressing the accelerator or brake pedals. Future enhancements include adding rotating pads under the front wheels to support steering as well integration with a miniSim™ for real-time driver-in-the-loop simulation.
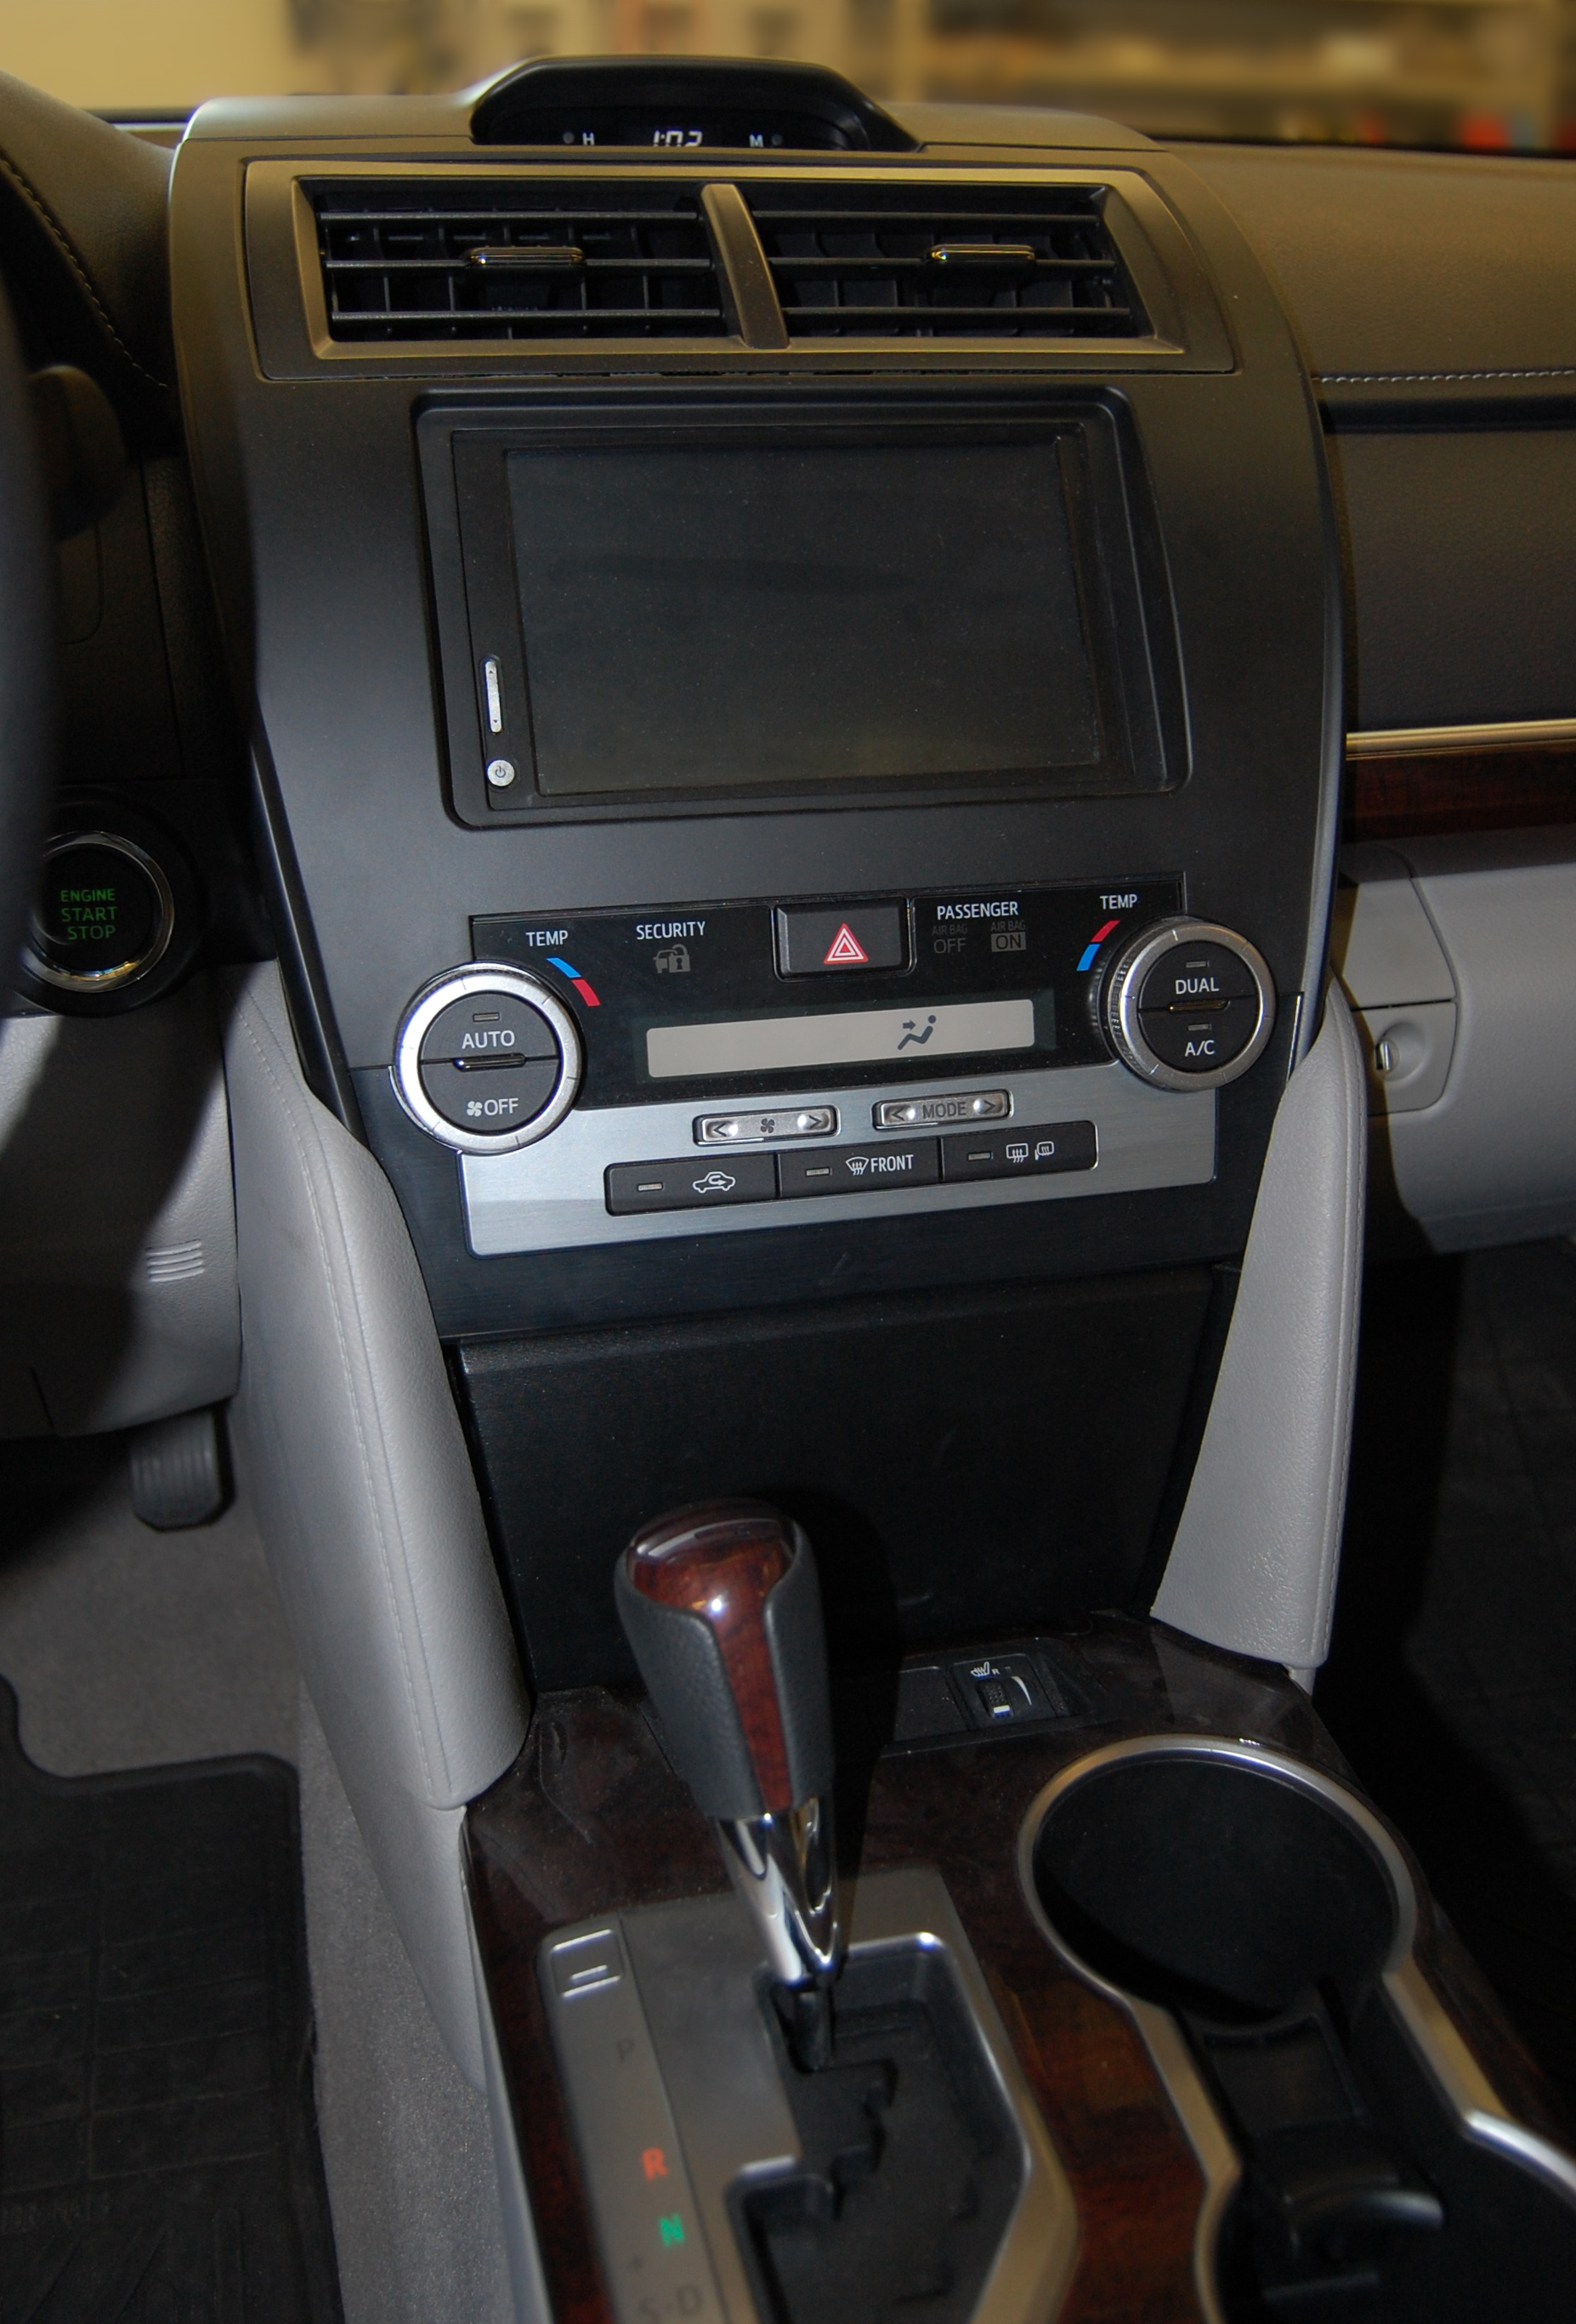
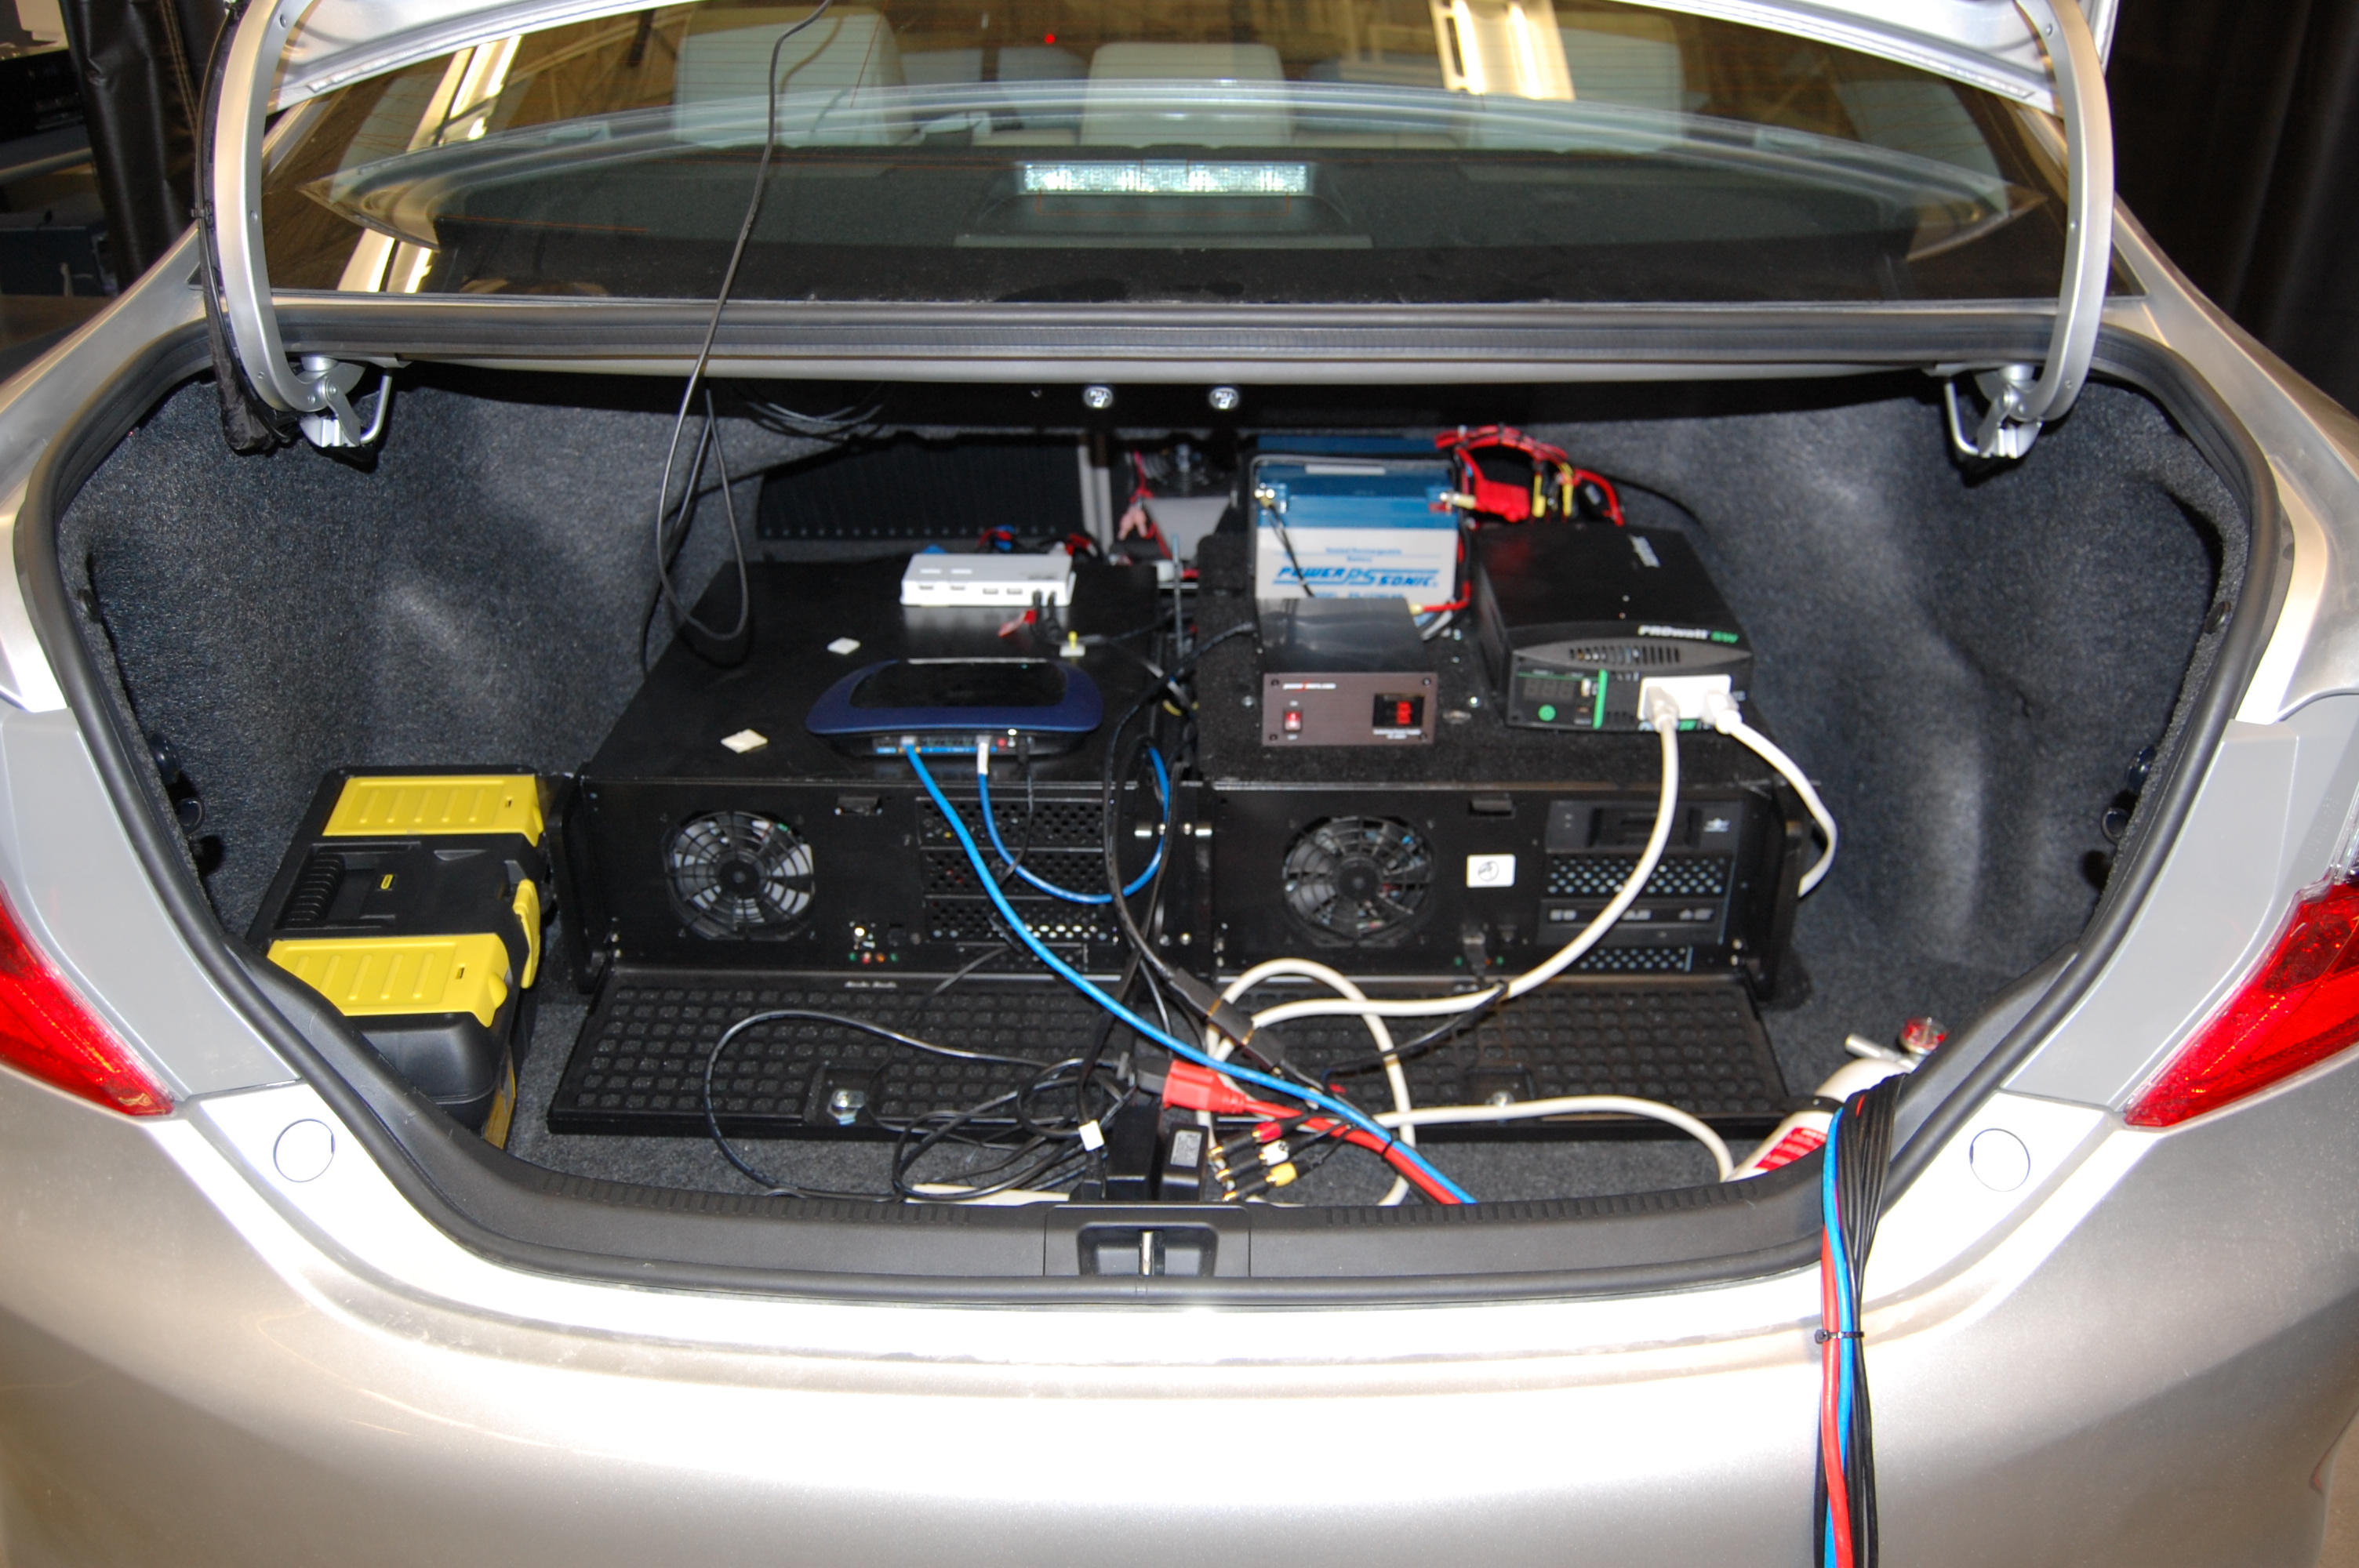
This vehicle features a versatile instrumentation package with the ability to collect data from multiple of sources. The vehicle has been designed to easily integrate with new sub-systems. The vehicle contains multiple repositionable video cameras for cab and roadway reviews.
List of instrumentation:
Data |
Update Rate |
Data Source |
|---|---|---|
Acceleration (X, Y, Z) |
30Hz |
Accelerometer |
Accelerator pedal position |
30Hz |
CAN Bus / Special instrumentation |
Brake pressure |
30Hz |
CAN Bus / Special instrumentation |
Transmission gear position |
30Hz |
CAN Bus |
Steering wheel angle |
30Hz |
CAN Bus |
Speed |
30Hz |
CAN Bus |
Odometer |
1Hz |
CAN Bus |
Outside temperature |
1Hz |
CAN Bus |
Seatbelt status |
1Hz |
CAN Bus |
Acceleration |
30Hz |
CAN Bus |
Low/High beam headlight status |
1Hz |
CAN Bus |
Brake light status |
30Hz |
CAN Bus |
Fog lamp status |
1Hz |
CAN Bus |
Wheel speed |
30Hz |
CAN Bus |
Airbag Deployment |
1Hz |
CAN Bus |
Anti-block Brake System status |
30Hz |
CAN Bus |
Cruise control status |
1Hz |
CAN Bus |
Seat position and angle |
|
Special instrumentation |
GPS Time |
5Hz |
GPS system |
Position: Latitude / Longitude / Elevation |
5Hz |
GPS system |
GPS Quality |
5Hz |
GPS system |
Video (4 streams) |
30Hz |
Video cameras |
In vehicle audio (1 stream) |
|
Microphone |
The vehicle has the ability to read any data that’s on the CAN bus through the OBD II port. It also has additional sensors to provide more granular data for accelerator and brake pedals. Table 1presents a summary of the data that’s available through the various sensors.
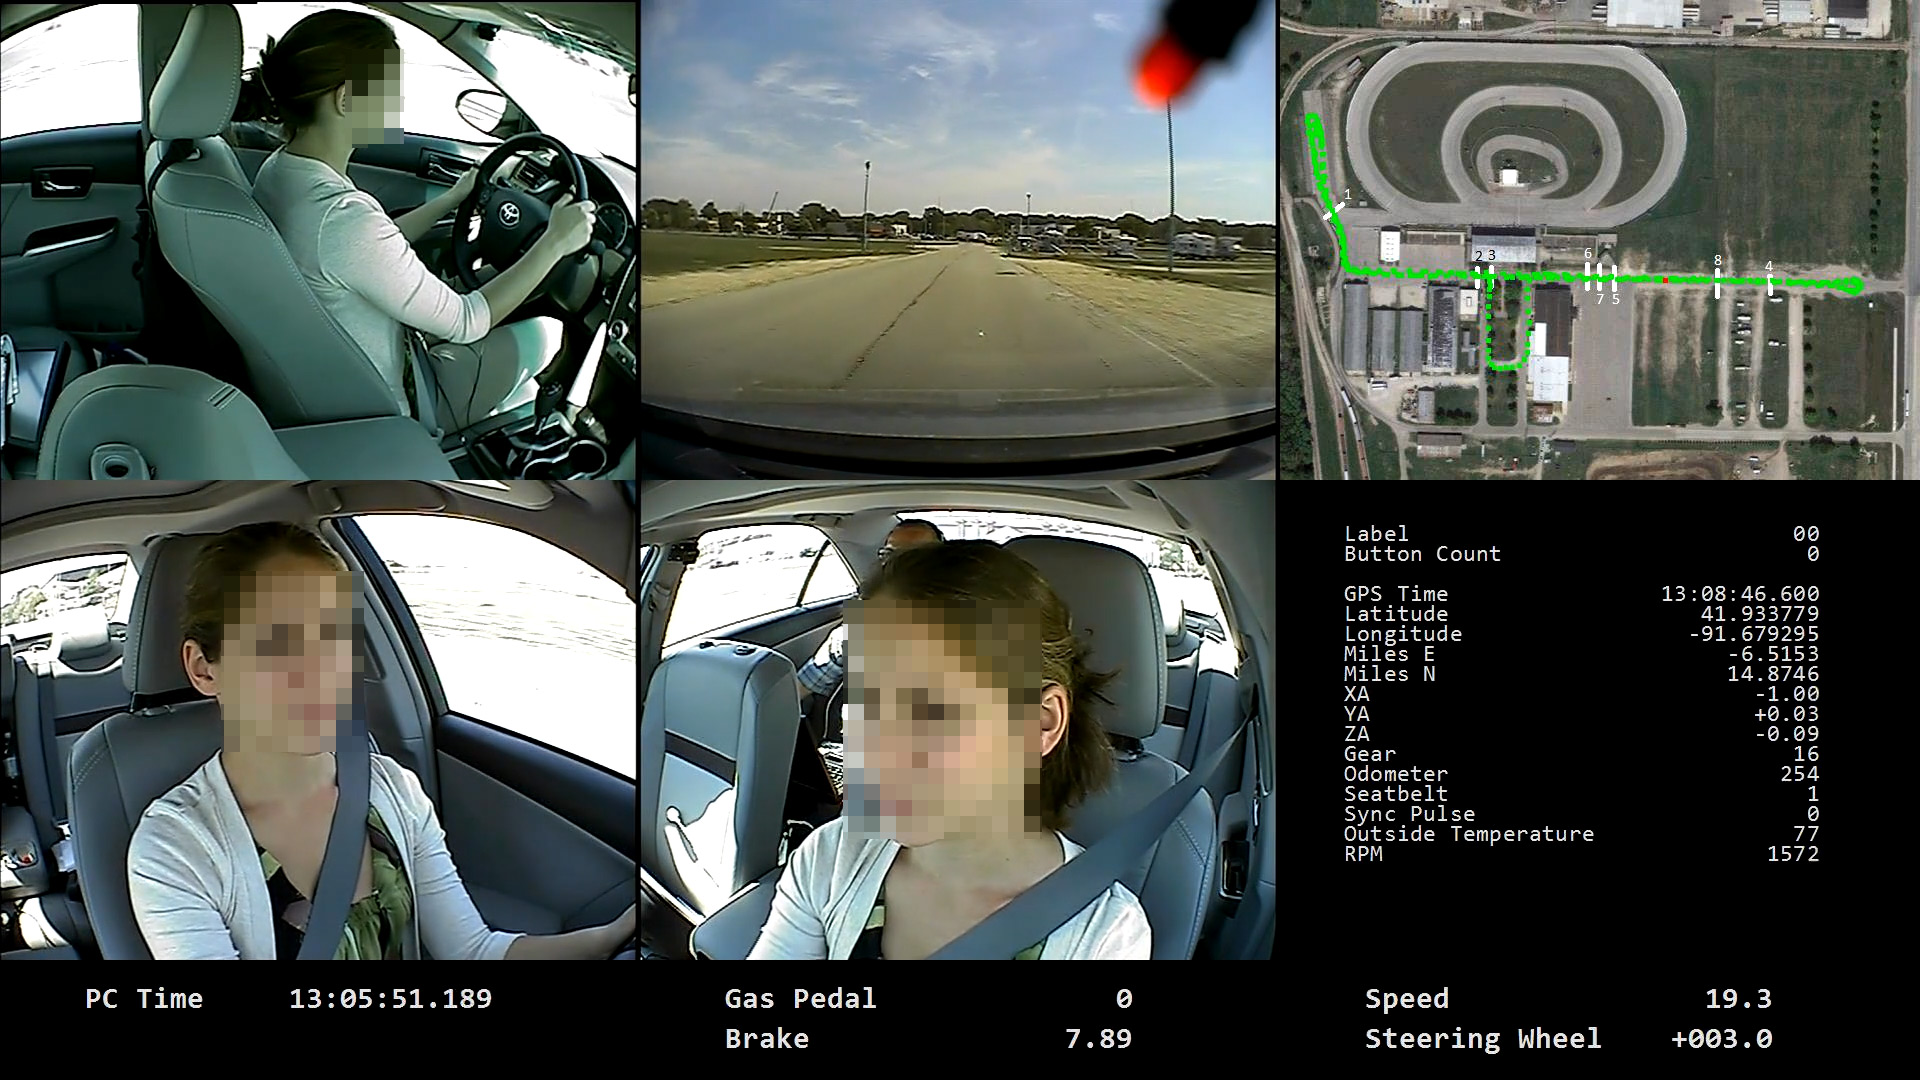
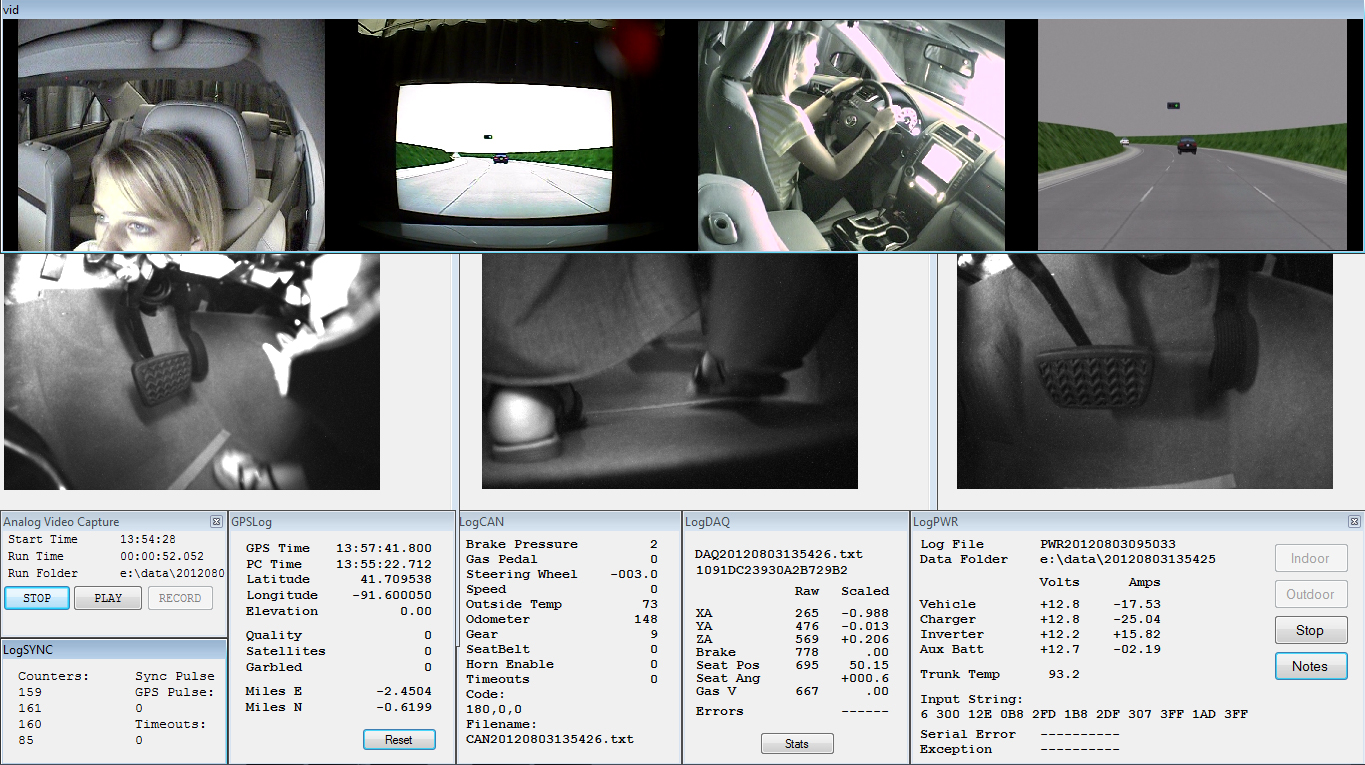
A custom written software suite enables experimenters to merge the video and data streams into one comprehensive package for data analysis. For each drive, the package consists of a synchronized data and video file as shown in Figure 4. This tool merges all data streams from different subsystems into one synchronized data file. It includes the frame number of all video streams in the merged data file. A lot of the raw data processing is performed in the creation of this merged file. The data from this file is ready to be used for analysis using 3rd party analysis tools. This data file contains data sampled at 30Hz.
Figure 4 shows a sample frame from the merged video file. It contains 3 different views of the participant and a forward view. The merged video file also shows a top down map of the test track where the data was collected. In the upper right part of the screen, it overlays the path that vehicle took through the track as well as the current location at each frame. The lower-right and bottom shows values from key data streams. The associated data file contains many more data streams.
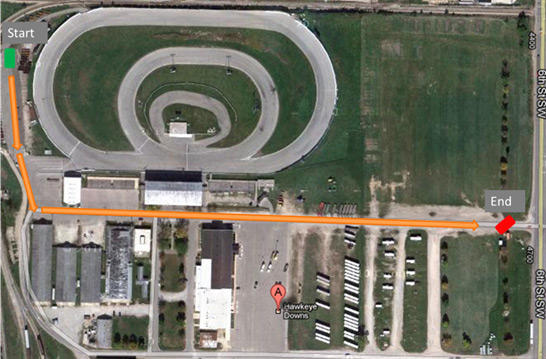
There are two test tracks located within 90 minutes of Iowa City (Cedar Rapids and Newton) that can be used for studies that require access to closed roads and tracks.
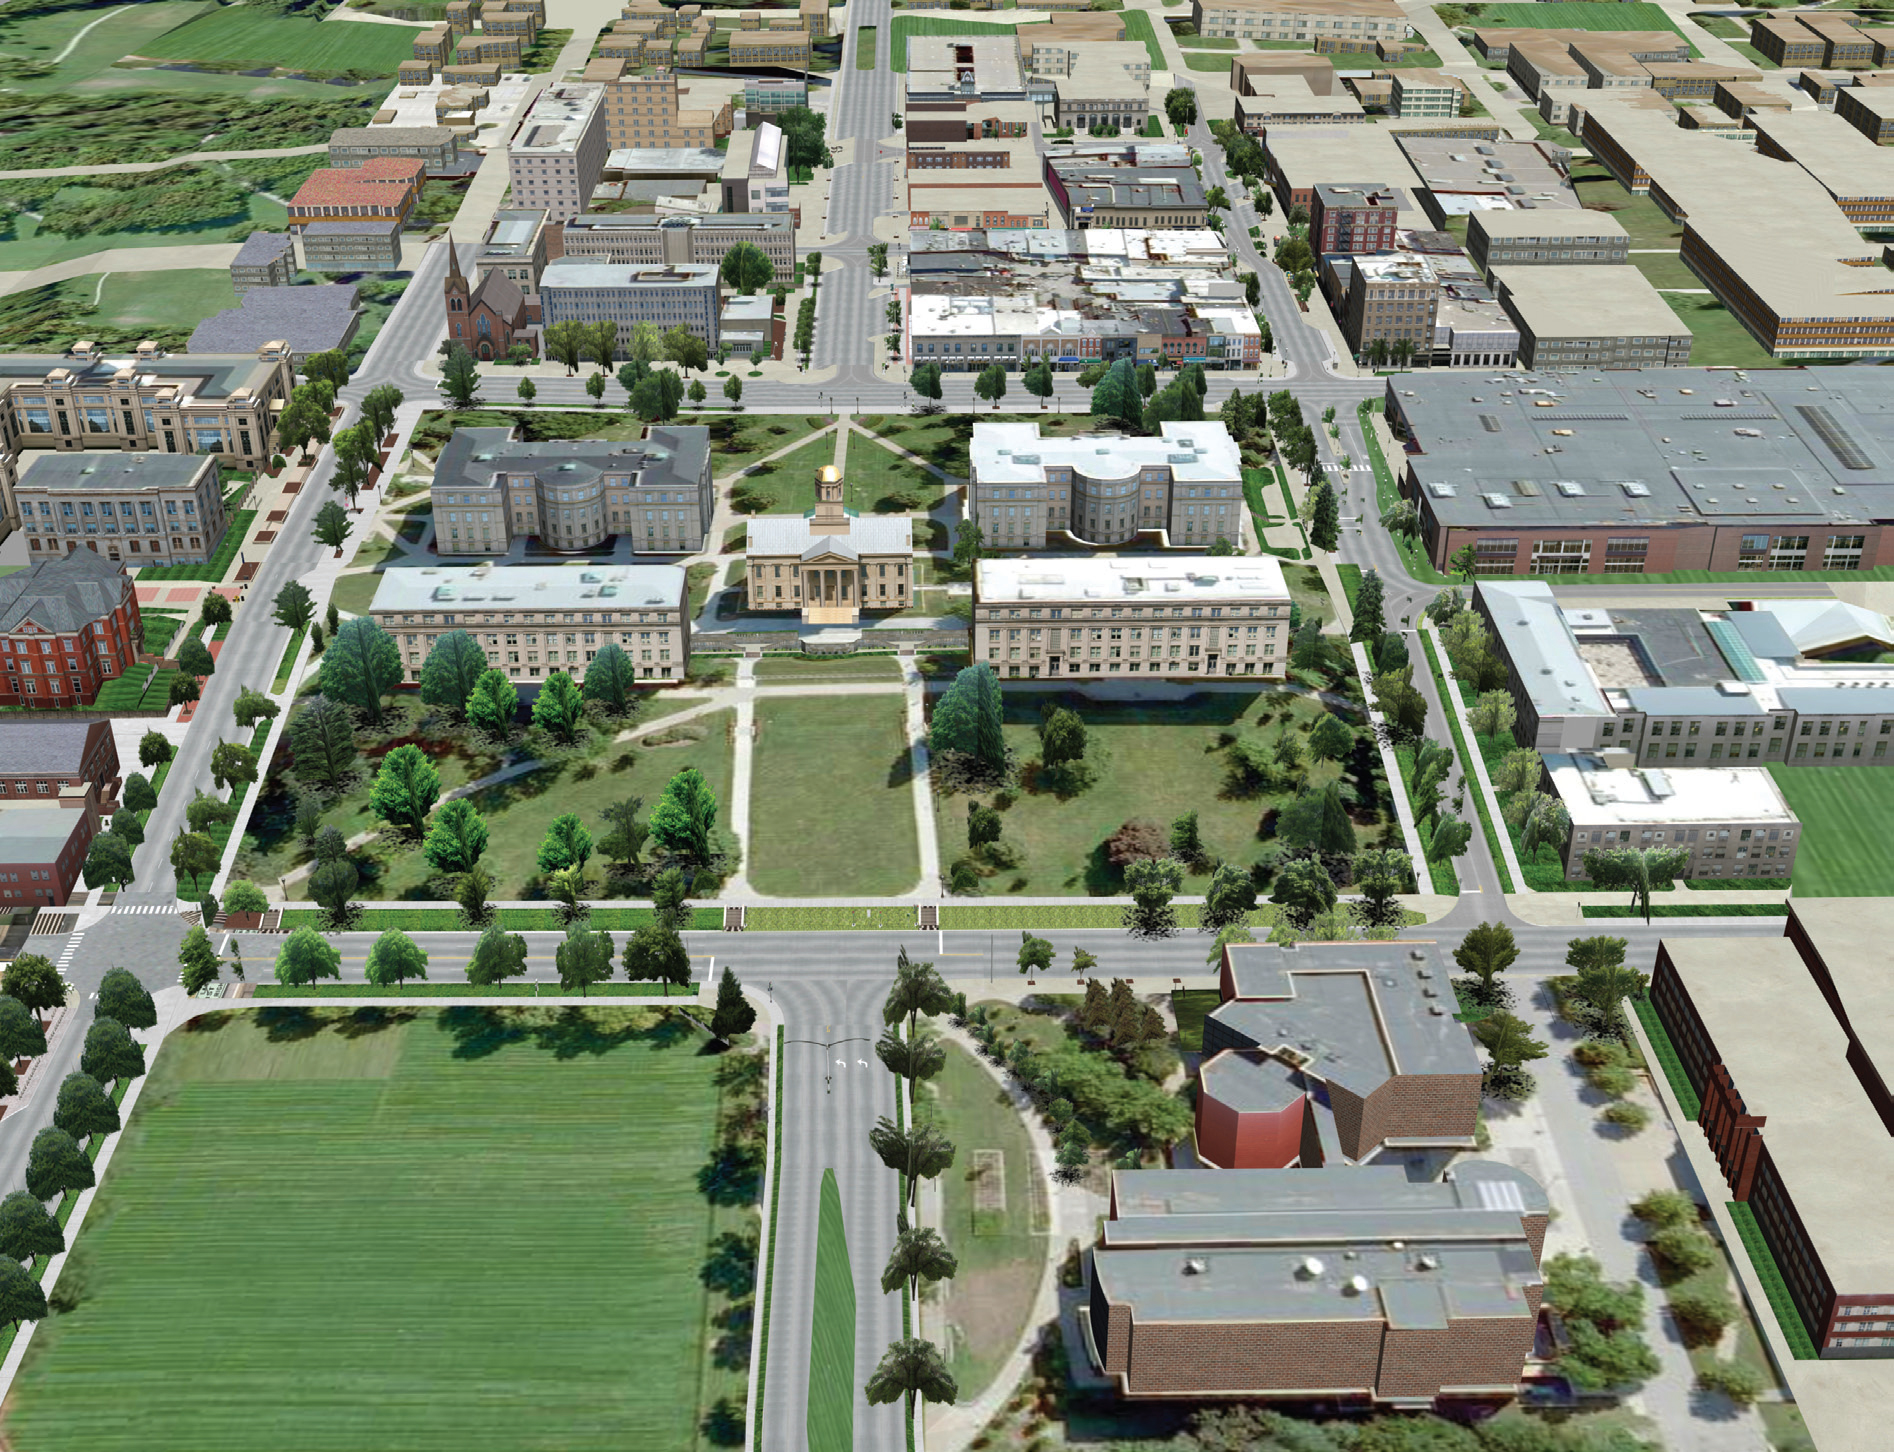
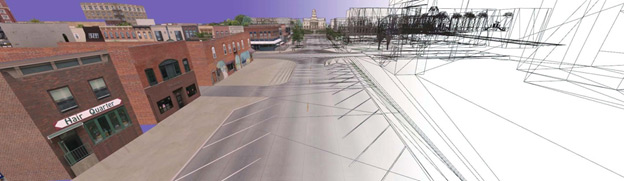
The instrumented vehicle can be utilized for validation studies on our suite of simulators. We have virtually replicated surrounding portions of Iowa City in our driving simulators. These virtual replicas of real world locations can be utilized to run validation studies on simulation research.
We have in-house capability to model any other real world location in our driving simulators.
More information about Virtual Iowa City can be found here.
 NADS On-road Vehicles
|
||
 |
| |
 |
| |
 |
| |
|
Why is fidelity important?
|
||
|
As fidelity increases, so too does the transfer of training and the accuracy of assessment, particularly among experienced or expert drivers. Lower fidelity simulation can be used for preparation and development of scenarios or study protocols without incurring the cost of high-fidelity simulation platforms. Lower fidelity simulation is also ideal for new driver training where full immersion is not necessary. |
||