TOOLS
Contents
Tool operating modes
The actions that the user can perform while using the ISAT change depending on the tool-operating mode. There are currently four operating modes, each focused on a different phase of the scenario development process. The four modes are authoring, rehearsal, monitoring and replay. The tool first starts in authoring mode. To switch modes, select the appropriate mode from the Mode menu or use the buttons in the mode toolbar:
Authoring mode (Edit Mode)
This is the tool‟s default mode, and is the leftmost button on the Mode toolbar. In this mode, the user can create new scenario elements and modify existing elements. In addition, various key-mouse combinations can be used for navigating around the map. Even though the specific details vary among different scenario elements, creating new and editing existing scenario elements follows a specific patter as described below.
Creating a new scenario element
To create a new scenario element, select the type of element either through the Insert menu or by clicking on the appropriate button in the toolbar. The cursor will change into a vertical arrow:
At that point, clicking on an appropriate location inside the work area will insert the element and pop up a dialog box that allows the user to specify object-specific attributes. Once the parameters have been set to the desired values, pressing OK will insert the element into the scenario. Since each scenario element has its own custom dialog box, the associated options and their meaning are described in the section that focuses on each element.
Editing an existing scenario element
Existing scenario elements can be edited by double-clicking on the element or by right clicking on the element and selecting „Settings‟ on the pop-up menu. Following either of these actions will pop up the object-specific dialog box that allows the user to modify the element‟s attributes. Certain elements that have no visual representation (such as Initial Conditions), these elements can be set from the menu.
Rehearsal mode
The Mode toolbar’s second button is rehearsal mode. It allows execution of the current scenario. A scenario is executed by running on the PC hosting the ISAT the same scenario control software used on the simulator. Even though the software is the same, the evolution of the virtual environment between the simulator and the ISAT will differ because whereas in the simulator there is a human driver that controls the vehicle, when running in the ISAT there is no way to interactively drive another vehicle that represents the driver.
To Rehearse a Scenario
To rehearse a scenario:
- Load the scenario on the ISAT
- Click the rehearsal button on the mode toolbar
- Once the “Scenario Rehearsal” dialog box appears, click on Start
- Double-click on any object to auto-center the map on that object
- Double-click on an empty spot of the map to release auto-center
- Click stop to terminate the simulation
- Click Dismiss to go back to editing mode
Rehearsal Mode Notes
Note that it is possible to use an autonomous driver model to simulate the simulator driver, however, the autonomous driver model “pretending” to be the human driver will operate autonomously, and can only be constrained on its actions by using available authoring tools. So for example, a human driver may drive all over the lane, the ADO simulating the human driver would more likely drive by properly tracking the center of the lane. At the same time, it is possible to force the driver to change lanes by using the lane change dial. In general, having a simulated human driver is better than not having one, but its availability does not eliminate the need for actual testing on the simulator.
To activate the “simulated” human driver, simply define a Start Position and optionally a path (See section 3.11.1) for the ownership. During rehearsal mode, an ADO will be added to the simulation with the same start position as the ownership and the same path as the one assigned to the driver. The simulated human driver will trigger the same triggers as the human driver, and in general will have the same effects as if a human driver is operating the NADS.
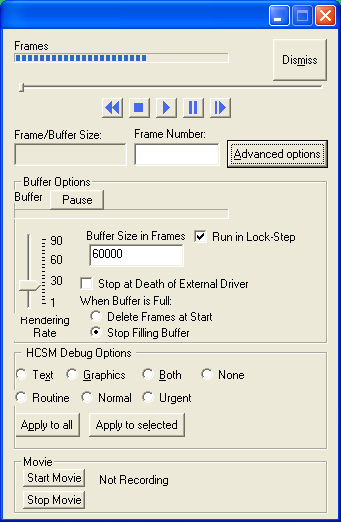
When the Rehearsal mode button is pushed, a command window will appear and after a short period, the dialog shown the figure 3-12 will appear. (NOTE: initially, the dialog box will not show options below the “Advanced” button; press the “Advanced” button to toggle display of the full dialog box).
The rehearsal mode operates by running “frames”. Each frame is produced by running the behaviors and dynamics for a given time period. The data is then stored as a “frame” in the “buffer”. The buffer is a collection of frames, and can be navigated through just like a movie.
The slider above the start button can be used to navigate through the buffer, or by entering the frame number in the “Frame Number” box and hitting Enter. The status bar under Buffer shows how full the buffer currently is. The “Pause” button by the buffer, pauses the operation filling the buffer, this may improve playback quality. The status bar under “Frames” shows how far the playback has progressed in the buffer. Once the “Frames” progress bar is at 100%, the playback may have to wait for more frames to be placed in the buffer.
The “Stop” buttons stops the simulation, and clears the buffer, the “Pause” button pauses the playback. If you want to go back to a frame that has already been deleted in the buffer (see advanced options), you will have to hit Stop, then Start again the rebuild that frame.
Advanced Options
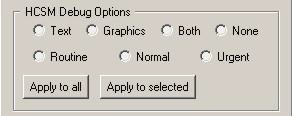
Pressing the “Advanced Options” button exposes additional options that can be used to fine-tune the simulation and how it is rendered. There are two groups of controls; the first group, titled “HCSM Debug Options” modifies how much information is presented by the behaviors during the simulation. The second group titled “HCSM Execution Options” controls the simulation time-step and ISAT rendering rate. Figure 3-13 shows the controls within the “HCSM Debug Options” group.
In general, debugging messages vary between different behavioral models and evolve to meet the need of the developers, but a few items are consistently provided and may be of use to users. It is possible to enable messages for a single behavioral instance (i.e., a single ADO or DDO), or for all elements in the simulation. Debugging messages can be provided as text, graphics or both. Depending on its importance, each message is classified as Routine, Normal or Urgent. To enable messages, first select the appropriate display mode (pick one of the four radio buttons on the top row), then pick which class of messages to display (pick one of the three radio buttons on the second row). Once the modality (text/graphics) and message class is selected, click on “Apply to all” to apply these settings to all current elements, or press “Apply to selected” to apply these settings on the element that is currently selected on the map. One important thing to remember is that these setting are applied when a frame is “run” not displayed. So if the buffer is at frame 2000, and the display is at frame 120 when one of the HCSM options is selected, you will not see the debug information until frame 2000 is displayed. If you select “Run in Lock-Step” this will insure the buffer will be no more than 1 frame ahead of the display.
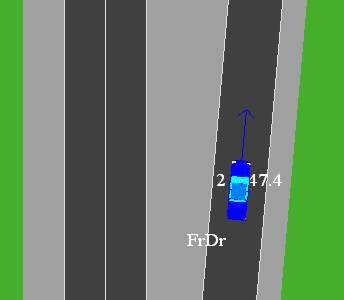
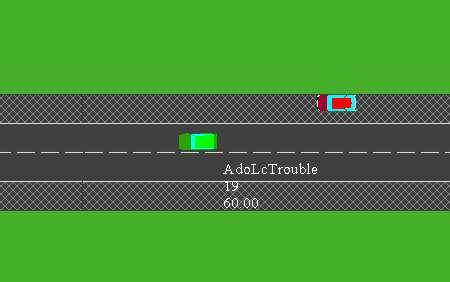
Note that if you pick display of text messages, a new window pops up. That window will list messages as they are generated by the behavioral models. Graphics messages generate additional graphics on the ISAT map during the simulation. For example, Figure 3-15 shows how an ADO appears when graphics debugging has been turned on for that object. A blue arrow provides information on the target point used by the steering controller, and 3 messages appear around the driver showing current speed (in mph, on the upper right), the object id (on the upper left) and the current state used to control the ADO (on the lower left).
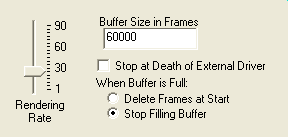
Figure 3-17 shows the “Advanced Options” group. The HCSM Execution Options group allows tuning the ISAT rendering rate. In addition, you can set the buffer size; the buffer is where ISAT stores the data for rehearsal playback. You can set whether ISAT will stop running frames when the buffer is full, by selection “Stop Filling Buffer”, or delete frames that have already been displayed by selected “Delete Frames at Start”. The “Stop at Death of External Driver” flag when selected will stop running rehearsal frames when the external driver has been removed from the simulation. The “Run in Lock-Step” option when enabled will only add frames to the buffer as needed by the display. For example, the rehearsal mode will wait for frame 119 to be displayed before adding frame 120 to the buffer. The rendering rate slider controls the rate at which the playback is shown in frames per second, with 30 being the normal playback speed.
Making a Scenario Rehearsal Movie
To facilitate documentation of scenarios, the ISAT allows making movies of the top down view of a simulation performed in rehearsal mode. To make a movie, there needs to be at least one codec capable of encoding video installed on the computer running the ISAT. A codec is software that “compresses and encodes” video to a data stream. In other words, it stores video data to a hard disk. Microsoft Windows 2000 and XP operating systems come with a few codecs that are appropriate for that task.
There are two methods to make a movie of a session. Both involve some necessary setup, but one method is more automated than the other is.
To make a movie using the automated method:
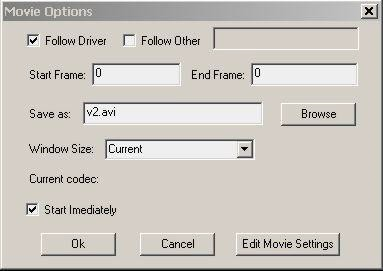
- After getting into rehearsal mode, press the “Start Movie” button on the Scenario rehearsal dialog box – The dialog box shown in Figure 3-14 will appear
- Select the appropriate options as described later.
- Make sure that the check-box titled “Start Immediately” is selected
- Press OK. The Movie Options dialog box will disappear but the simulation will begin. All rendered frames will be saved on the specified file as an AVI movie. Once the predefined number of simulation time steps have finished, movie making as well as the simulation will stop. The ISAT will remain in rehearsal mode.
To make a movie using the manual method:
- After getting into rehearsal mode, press the “Start Movie” button on the Scenario dialog box – The dialog box shown in Figure 3-14 will appear.
- Select the appropriate options as described later.
- Make sure that the check-box titled “Start Immediately” is not selected
- Press OK. The Movie Options dialog box will disappear but nothing happens automatically. From that point on and until the “Stop Movie” button is pressed, all rendering of the ISAT will be accumulated into the file as another frame of a movie. Note that the ISAT renders the top down view for many different reasons: the user zooms in or out, the user changes the panning center, or a simulation time step elapses.
- Press Stop Movie to close the file and complete the movie.
Movie Making Notes
Both the automatic and manual movie-making mode makes use of several common parameters. At the same time, some of the parameters make more sense in automatic mode rather than manual mode.
In automatic mode, it is useful to have the top-down view automatically center on the simulated driver, or on any other object in the simulation. Enable the “Follow Driver” checkmark to auto- center the view on the simulated driver, or enable the “Follow Other” checkmark to activate the adjacent text field into which you can type the name of any of the objects that will act as the auto- center target. In manual mode, this setting is not as important as you can pan manually or select which object to auto center by double-clicking on it.
The name of the AVI file under which a movie is saved can be specified by typing the filename in the text-field titled “Save as:” Press the “Browse” button to select a specific directory or pick an existing file to overwrite.
By default, the size of each video frame is equal to the size of the ISAT window. You can select a different window size by resizing the ISAT window before getting into movie making mode, or by picking a window size from the drop-down menu titled “Window Size”. Note that some codecs have limitations on the size of each video frame. If the ISAT or any of its components crashes consistently when making movies, especially when using codecs that did not come with the OS, experiment with some of the pre-defined window sizes (all of them use multiple-of-8 screen sizes).
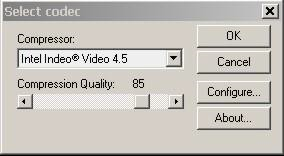
You can select the codec to be used for encoding the video and configure it by Press “Edit Movie Settings” to select the codec. A window similar to the one shown in Figure 3-14 will appear. The “Compressor:” drop down menu will include all available codecs. The “Configure” and “About…” buttons provide codec specific functionality and information. Depending on its capabilities, there may be additional windows that allow for setting the quality, compression ratio and other similar settings. Such windows are codec specific and are not covered here. Typically, there may be additional quick settings available on the “Select codec” window. In the example shown in Figure X, the selected coded (Intel Indeo Video 4.5) allows a single compression quality setting, in addition to other settings selectable after pressing the “Configure…” button.
When in automatic mode, you must type the first and last simulation step that you would like included in the movie in the text fields titled “Start Frame” and “End Frame” respectively. Simulation steps (or frames) are measured starting with 0. For example, to make a movie of the first 20 seconds of a scenario and assuming you have not changed the default simulation time steps, you would type 0 and 600 for the start and end frame respectively.
Monitoring Mode
The monitoring mode is a special mode that can only be used when the computer running the ISAT is within the NADS network. In this mode, the ISAT connects to the simulator’s real-time system, obtains information about the position and state of all visible entities in the virtual environment, and displays them in real time in the ISAT window. In addition, the user can “take control” of a single autonomous entity and control it though issuing certain high-level commands.
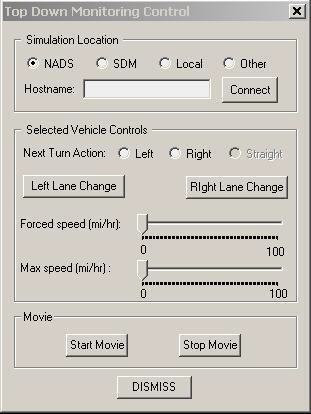
Figure 3-16 illustrates the dialog box that allows control of top down monitoring mode. The “Simulation Location” area allows specification of which simulator’s real-time system the ISAT should connect with. When “Other” is clicked, the user can specify an IP number of host name (assuming DNS is available) for the computer running the real-time scenario software. Once the host has been specified, pressing the “Connect” button initiates the connection. After a short delay, the ISAT will connect or print an error message indicating that it cannot connect.
Once a connection has been achieved, the main map window will display a top down view of the simulator’s virtual environment. The refresh rate may vary depending on the complexity of the map and the number of vehicles in the traffic.
The sub-area titled “Selected Vehicle Controls” is functional when the user has selected one of the vehicles in the virtual environment. It contains a variety of controls that can affect the behavior of the selected traffic element. Note that for these controls to work, the selected element must be an ADO, not a DDO. At the current version, the ISAT cannot tell the user if the selected object is an ADO or a DDO, so the user must be familiar with the scenario before using these controls. Three of these behaviors can be controlled; these are: intersection turning behavior, lane change behavior, and speed selection. Clicking on the radio buttons titled “Left” or “Right” will override the next turn decision that that traffic element has to make. For this to work, the button has to be pressed before the traffic element has committed to the turn; in addition, the turn should be feasible, i.e., the car has to be on the right lane or have enough time to make a lane change. Sometimes, the commit time is surprisingly early making it appear as if the control is not working. The two lane-change buttons operate in a similar manner; they send a command to the element indicating it should make a lane change of the appropriate direction. Finally, there are two speeds that can be set. The max speed limits the naturally occurring maximum speed selected by the traffic element. The traffic element may not reach that speed due to road curvature, other vehicles ahead etc.; however, if possible it will travel as fast as specified in the “Max speed” setting. The forced speed commands to the traffic element to travel at the specified speed, no matter what. The traffic element will ignore curvature, traffic lights, other traffic, and simply go as fast as command. This can cause major problems if abused.
The Movie settings allow recording the evolution of the scenario to a file. See section 3.3.2.2.3 for details on how to specify movie settings.
Playback Mode
The last ISAT mode is the Playback mode. This mode is integrated to provide playback of a simulation that took place on a simulator, provided specific data streams have been collected in a file using the NADS Data acquisition format (NADS DAQ). The NADS and SDM data collection system can be easily configured to collect this data, making it very easy to re-play simulations on the ISAT.
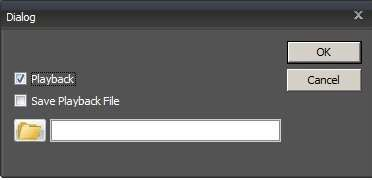
Once the playback mode is selected, a dialog box pops up to allow finer control of mode specific parameters. Figure 3-22 illustrates this dialog box.
The first thing that must be done is selecting the DAQ file to play back. Use the file selection button to bring up a file-selection dialog box. The NADS DAQ files contain data in a binary format that is very efficient for storage but not very efficient for random access. ISAT creates a TOC file for efficiently accessing this data. It may take several minutes to create this TOC file. The TOC file is stored in the same location as the DAQ file, and once created it is used to re-open the DAQ file efficiently. ISAT automatically looks for the TOC file in the same directory as the DAQ file. When copying a DAQ files from a location try to copy over the .toc file, as this will prevent ISAT from having to re-create the DAQ file. If a TOC file does not exist for a given file, and the permission for the directory the file is stored is read-only (such as on a The TOC file replaces the cache system that was used before.
It is important to note that if frames are dropped in the DAQ file some data output may not be 100% correct. Specifically the graph and frame search features may be off slightly due to dropped frames. In addition, any data that should have been collected in the dropped frame would be lost and not available. These errors are not common and in most cases only have minor effects on the accuracy of the data.
Once a file is loaded, the horizontal slide titled “Frame” will show the number of frames available in the DAQ file. The row of buttons immediately below the slider allows VCR-type control of the replay. Seven buttons are provided implementing the following functionality respectively: Play fast backwards, seek back one frame, pause, play, stop, seek forward one frame, and fast forward. In addition to these buttons, the slider itself can be moved around to seek to a specific place in the file. Moving the slider around will cause the main window to display, as fast as it can, the respective frames.
During replay, the Movie buttons can be used to record a movie. Please see section 3.3.2.2.3 on details on recording movies.
During replay, several controls allow fine-tuning the amount of information that is provided to the user. The “Show Text” and “Hide Text” buttons control display of extra labels associated with a selected traffic element. Figure 3-18 shows an example of one traffic element for which text display has been turned on.
In addition to text display, the Playback Mode dialog box displays the current frame as well as the number of traffic elements in the scene. It can also show an ongoing textual display of the values of any other variable that is present in the DAQ file. The value shown for each variable corresponds to the same frame as the animation. To display the value of any of the variables in the DAQ file during the playback do the following:
- Click the drop down menu titled “Names:”. Pick any of the variables you would like to see
- Press the button “Add Variable”
- Next time a new simulation frame is rendered, the value of the variable during that frame will appear in the window at the bottom of the dialog box.
Once a variable is displayed, you can remove it by selecting it in the list box and clicking the “Delete Variable” button.
Search Playback
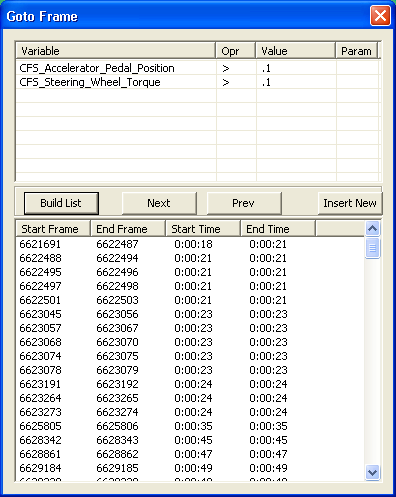
As of version 1.1.31, a new Search feature has been added to the playback. This search feature has been added to allow the searching through the playback for instances for when a given statement is true. Such as Brake Pedal Force > .1, will return all the periods when the brake pedal force what greater than 0.1. This search feature can be accessed by clicking on the “Search Frames” button in Figure 3-22.
Let’s say we want to find where CFS_Accelerator_Pedal_Position is greater than .1 and the CFS_Steering_Whell_Torque is greater than .1. First, open the "Go to Frame" window by clicking on “Search Frames” as seen in Figure 3-24. From this window, we can build our expressions. Each expression needs 3 things, a Variable, an Operator, and a Value. By Clicking on the cell in the Variable column, it brings up a drop-down where we can select the available variables from the DAQ file. Likewise clicking on the “Opr” column will bring up a drop down where we can select the operator (+, <, >). The value is typed in. The “Param” column takes in the Column number of the variable to use. For instance if we have the variable SCC_LogStream and we want to compare the 3rd value of the variable we would put 3 in the column. If no value is placed in the param column, it is assumed that it is the first value. We can enter multiple expressions, should we run out of available spaces to enter expressions, we can click on the “Insert New” button, and it will insert a new row. The “LogOp” or logical operator column selects the logical operation to be performed between the current row and the next row, if no operation is selected then the AND operation is used. If the row is the last row in the expression then this column is ignore.
Once we have our expressions built, we hit the “Build List” Button. It then finds all there periods where our expressions are true. This can take several minutes depending on the length of the DAQ file. Once the list is built, you can click on the Frame number and it will advance the DAQ playback to that frame number.
We can also produce expressions that are more complex by clicking on the “Advanced” button. This will allow the creation of a text based expressions. The “(“ and “)” are used nesting the expression, each sub expression, such as CFS_Accelerator_Pedal_Position > 0.1 must be enclosed in “(“ and “)”. The following logical operations are allowed between sub-expressions AND, OR, | (or), & (AND). Also the expressions are case sensitive, so the variable CFS_Accelerator_Pedal_Position, must be typed in exactly, for example CFS_Accelerator_Pedal_Position, would not work as it does not match exactly.
Playback Graph
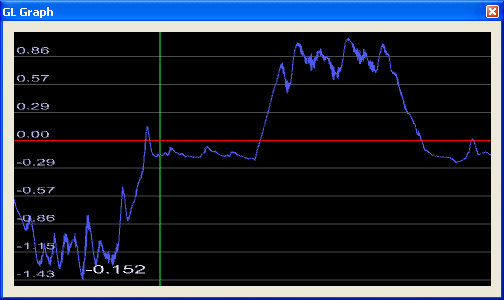
Another new feature that has been introduced in the 1.1.31 release is the Graph feature. This feature allows the graphing of a variable for either the next minute from the current position in the playback or for the entire playback.
To select the variable that you wish to graph, first select it in the “Name” dropdown in the playback dialog (Figure 3-22). Then to graph the variable hit either the Minute Graph, to graph the variable for the next minute, or Full Graph, to graph the variable for the whole DAQ file. It may take a few minutes to generate the graph. The Minute Graph should take a lot less time to create than the Full Graph. Once done the GL Graph window will come up (Figure 3-25). The green line in the graph is the current position in the DAQ file. The mouse wheel stretches or shrinks the graph along the X- axis (width). Z and X shrinks and expands the graph along the Y-axis (height). The arrow key moves the graphs position, and the “Home” key resets the view back to original view. The value of the variable at the current position in the DAQ file is displayed in the lower left hand corner.
Open Movie
When the Open Movie button is clicked, it brings up an open dialog button to open a movie file related to the current daq file. When the movie file is selected, it will be displayed in a pop-up window. As the daq file is played, it will synchronize the movie with the daq file. The “+/-“ button allows for setting an offset between the current video frame and the daq frame. Since the daq file and the video file will not always start at the same frame, it may become necessary to adjust the start position of the video. In order for this feature to work, your computer must have an mpeg-2 decoder capable of efficiently seeking.
